Shopify analytics: the 7 numbers that actually matter (ignore the rest)
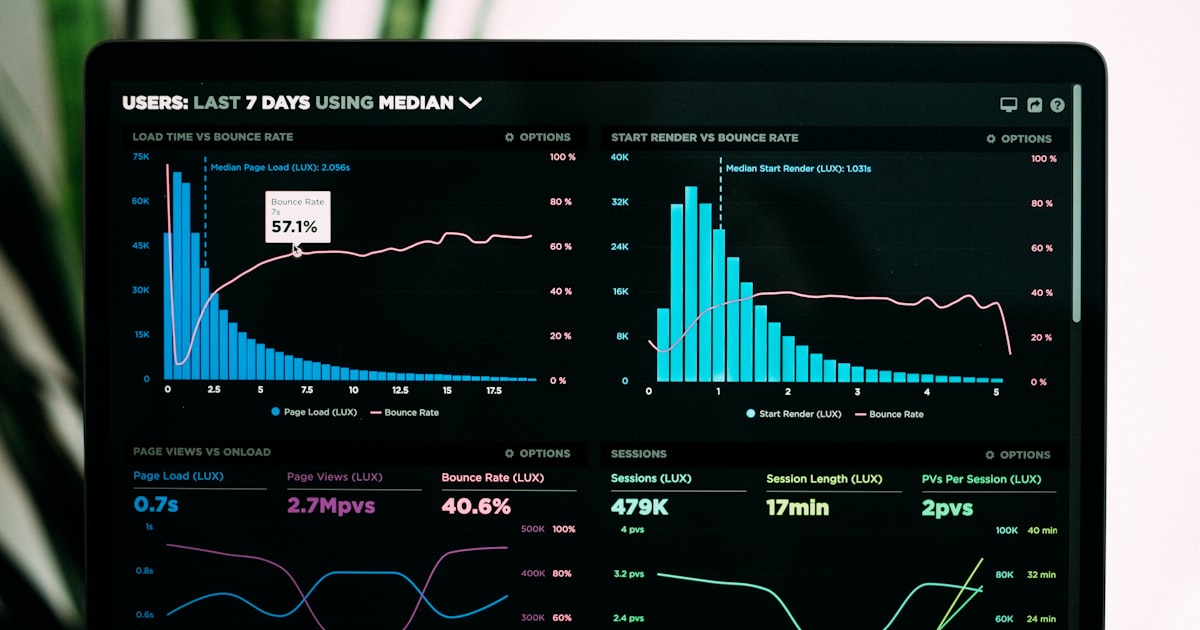
Your Shopify dashboard tracks dozens of metrics by default. Sessions, bounce rate, pages per session, top landing pages, returning customer rate, traffic by source, abandoned checkout rate. Most of them don't tell you whether your business is growing or dying.
I've reviewed analytics for a lot of Shopify stores. The ones that struggle aren't missing data. They're drowning in it. They track everything and act on nothing because there's no signal in the noise.
- The average Shopify store converts at 1.4–1.8%. Top 20% hit 3.1–3.5%. Know which sources are above and below your average.
- Repeat purchase rate under 20% means your retention is broken. Fix it before you spend more on ads.
- Contribution margin below 15% means no amount of traffic saves you. Fix unit economics first.
- Most small Shopify stores need 3 metrics, not 47. Scale up your dashboard as revenue grows.
For Shopify analytics for small stores, 7 numbers do 90% of the work: conversion rate by source, repeat purchase rate, AOV, contribution margin, CAC, revenue by channel, and MER. Everything else is context, not signal. Here's each one and what it's actually telling you.
1. Conversion rate by source
Most founders look at overall conversion rate. That's the wrong number. The average Shopify store sits at 1.4–1.8%. Knowing you're at 1.6% tells you almost nothing about where to focus.
Conversion rate by sourcetells you everything. Email traffic converts at 4.2% on average. SMS campaigns hit 5.1% during time-sensitive sends. Organic search runs 2–3%. Paid social varies from 0.5% to 3% depending on creative and audience match. If your email list converts at 4% and your Facebook ads convert at 0.8%, you should be investing in your email list, not your ad creative.
Top 10% of Shopify stores convert at 4.7–5.2%. They get there by doubling down on channels that already convert, not by spreading spend evenly. Find your best source and build there first. Then fix the others.
Where to find it: Shopify Analytics → Acquisition → Sessions by referrer, cross-referenced with orders. Or use a tool like Triple Whale for proper multi-touch attribution if you're running multiple paid channels.
2. Repeat purchase rate
This is the number most small stores ignore until it's too late. Your repeat purchase rate tells you whether customers actually liked what they bought enough to come back. The industry average is 27–30%. Under 20% and you have a retention problem, not a traffic problem.
Consumable brands (supplements, skincare, pet food) should target 35–45%. That's natural replenishment. If your supplement brand is sitting at 22%, your post-purchase experience is failing. Home goods and electronics can run 20–25% because purchase cycles are longer. Know your category benchmark before you judge the number.
Pouring ad spend into new customer acquisition when repeat rate is under 20%. A new customer costs 5–7x more to acquire than retaining an existing one. Fix your email flows and post-purchase experience first, then scale acquisition. The math behind retention vs acquisition for ecommerce makes this even clearer.
3. Average order value (AOV)
The average Shopify AOV is $85–92. Top 20% of stores hit $120+. Desktop orders average $155 vs $112 on mobile. If you're sending paid traffic to mobile landing pages and revenue feels thin, that $43 gap per order is part of the answer.
AOV is the simplest lever most stores underuse. A $10 increase in AOV on 500 orders a month is $5,000. You don't need more customers. You need smarter order structures. Bundles, free shipping thresholds, post-purchase upsells, complementary product recommendations at checkout.
The best AOV move for most small stores: set your free shipping threshold at 120–130% of your current AOV. If you average $70 orders, put free shipping at $85. People add one more item to qualify. It works almost every time and costs you nothing to test.
4. Contribution margin
This is the number most Shopify dashboards don't show you. And it's the most important one. Contribution margin equals revenue minus COGS minus all variable costs: shipping, payment processing (usually 2.5–3%), return costs, and customer acquisition costs.
A healthy contribution margin is 20–25% after all of that. Below 15% and your unit economics are broken. You can't grow your way out of broken unit economics. Every new sale loses money faster. Below 10% means stopping paid acquisition entirely and fixing the cost structure before anything else.
Health and wellness brands average 47.66% contribution margin before acquisition costs are layered in, but many stores in the category still land at 15–20% once CAC is factored in. The gap between the two numbers is where your profit disappears. Most stores don't track both, which is why they think they're fine until they aren't.
5. Customer acquisition cost (CAC)
CAC is up 40–60% across DTC verticals since 2023. Fashion brands now average $90–120 per new customer. Beauty and skincare runs $90–130. Electronics can hit $100–377. These aren't bad numbers unless your AOV and margin don't support them.
The formula: total acquisition spend (ads, influencers, referral programs) divided by new customers acquired that month. Track this monthly. If CAC is rising faster than AOV, your margins are compressing. If CAC is flat while repeat rate is rising, your LTV is improving. Those are the two outcomes you're managing.
If CAC is rising month over month, paid ads aren't the problem. Your creative is. Or your landing page. Or your offer. Throwing more budget at rising CAC makes it worse. This is also why email automation flows matter so much: email drives repeat purchases with near-zero marginal CAC. Every repeat customer you get from email is CAC you didn't have to pay.
6. Revenue by channel
You need to know what percentage of revenue comes from each channel: paid social, email, SMS, organic, direct, referral. Not sessions. Revenue. Sessions lie. A channel with 40% of your traffic that drives 8% of your revenue is a cost center, not an asset.
Email delivers $36–79 ROI per dollar spent in 2026. SMS hits $71–79 per dollar. Meta paid social averages 1.86–2.19x ROAS platform-wide, down 4–10% year over year even with Advantage+ enabled. If email is under 15% of your revenue, you have untapped owned channel potential that's worth more than your next ad test.
The healthy channel mix for a $30K+/month Shopify store: email at 25–35% of revenue, paid social at 20–35%, organic at 10–20%, SMS and direct rounding out the rest. Below $10K/month, focus on getting email above 20% before scaling paid. See how much to spend on ecommerce marketing by revenue tier for the allocation breakdown.
7. Marketing efficiency ratio (MER)
ROAS tells you how one campaign performs in one platform's reporting. MER tells you whether your whole marketing operation is profitable. MER equals total revenue divided by total ad spend across all channels. A MER of 3:1 means every $1 you spend on marketing brings in $3 in revenue.
The blended ROAS benchmark for 2026 is 2.87:1 across platforms, down from 3.2:1 in 2023. If your MER is below 2.5:1 and your margins are tight, paid acquisition isn't your growth path right now. Focus on conversion rate, AOV, and email revenue first. Get MER above 3:1 before scaling spend.
Trusting platform-reported ROAS as your profitability signal. Meta reports 3.4x. Google reports 4.1x. Add them together and it's more than your total revenue. Platforms take credit for every sale they touched, including ones that would have happened anyway. MER uses your actual revenue against your actual spend. That's the only number that doesn't lie.
What founder-tier Shopify reporting actually looks like
These 7 numbers fit on one page. You don't need a 40-slide agency deck to understand your business. You need a weekly dashboard with: conversion rate by source, repeat purchase rate, AOV, contribution margin, CAC, revenue by channel, and MER. Review trends monthly. Act on the ones that are moving in the wrong direction.
A solid Shopify marketing strategy starts with knowing these numbers cold. Once you do, the right moves are obvious. Conversion rate is the problem? Work on product pages and creative. Repeat rate is low? Build the email flows. CAC is rising while MER drops? Pause paid and fix the creative. The data tells you what to do if you're looking at the right data.
I personally review these 7 numbers for every brand I work with before touching any marketing. It takes 20 minutes. It prevents months of wasted spend. Most stores that come to me have been running ads for 6 months without knowing their contribution margin. That number alone changes everything.
Frequently asked questions
What's a good conversion rate for a Shopify store?
The average Shopify store converts at 1.4–1.8%. The top 20% of stores hit 3.1–3.5%, and the top 10% reach 4.7–5.2%. If your overall rate is under 1%, fix your product page and checkout flow before spending more on traffic.
What repeat purchase rate should a Shopify store aim for?
The industry average is 27–30%. Below 20% means your retention is broken and fixing it will grow revenue faster than acquiring new customers. Consumable brands (supplements, skincare, pet food) should target 35–45% because of natural replenishment cycles.
How do I calculate contribution margin for my Shopify store?
Contribution margin equals revenue minus COGS minus all variable costs: shipping, payment processing (typically 2.5–3%), return costs, and customer acquisition costs. A healthy Shopify store runs 20–25% contribution margin after all those deductions. Below 15% means your unit economics are broken.
What is MER and why does it matter more than ROAS?
MER (Marketing Efficiency Ratio) is total revenue divided by total ad spend across all channels. Unlike platform ROAS, which double-counts attribution and inflates performance, MER uses your actual revenue. A blended MER of 3:1 or higher is the target for most Shopify stores. The 2026 benchmark is 2.87:1.
Which Shopify analytics numbers matter most for a store under $10K/month?
At under $10K/month, focus on three: conversion rate by source (which traffic actually buys), AOV (what to bundle or upsell), and revenue by channel (which channels are actually producing). The other four metrics matter more once you scale past $30K/month and have enough volume for the signals to be reliable.

Want to see where your marketing stands?
Get a free AI-powered audit of your online presence. Takes 30 seconds.
Get my free audit