Meta inflates your ROAS by 40%. Here's what's actually happening.
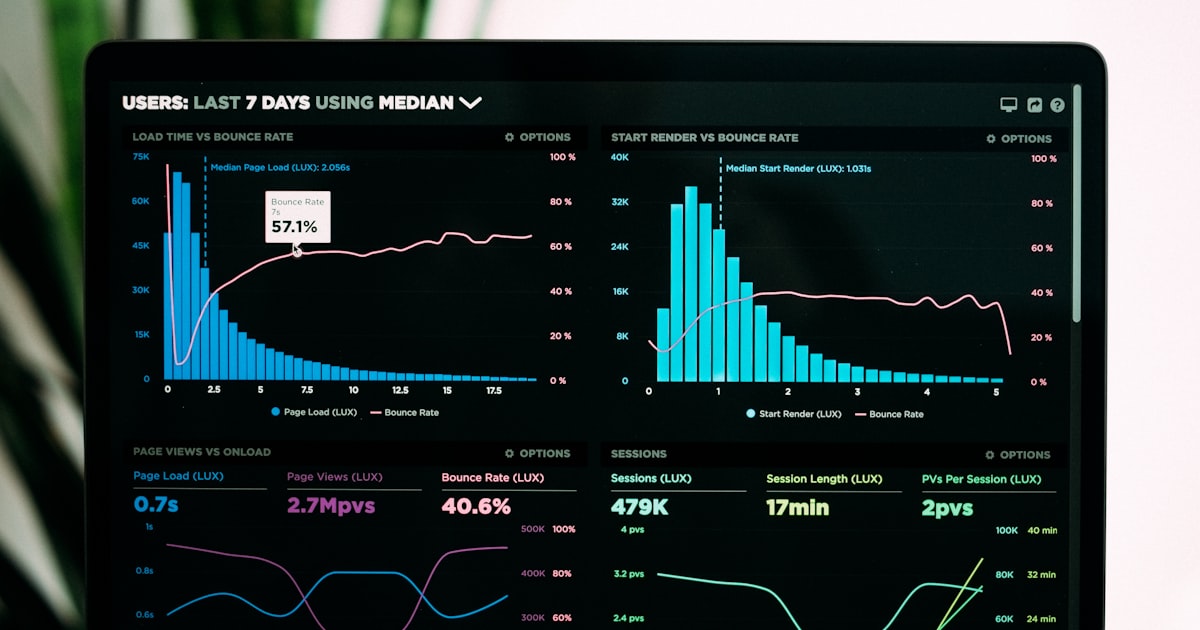
You run the campaign. Meta reports 4.2x ROAS. Looks good. You bump the budget. Then you open Shopify. Meta says $8,400 in revenue. Shopify attributes $4,100 to paid social. Same timeframe, same ads, same customers. One of those numbers is wrong.
In January 2026, Meta deprecated two attribution windows that most Shopify brands had been counting on. Most founders didn't notice. But it explains why your dashboards have never agreed, and why the gap is getting worse.
- Meta's attribution gaps now run 40-70% for most ecommerce brands, up from 30-40% in 2021 when Apple launched ATT.
- 85% of iOS users opt out of tracking, leaving your Pixel capturing only 40-60% of actual conversions on Apple devices.
- On January 12, 2026, Meta deprecated its 7-day view and 28-day view windows, causing a 15-30% overnight drop in reported conversions for many accounts.
- The fix isn't switching platforms. It's running server-side tracking and measuring a blended efficiency metric instead of trusting any single platform's ROAS number.
For most Shopify brands running Meta ads in 2026, the platform over-reports ROAS by 40-70% compared to first-party data. The gap comes from three compounding problems: iOS privacy opt-outs, deprecated tracking windows, and a Shopify pixel change that most founders missed entirely.
What Meta changed in January 2026
On January 12, 2026, Meta deprecated the 7-day view and 28-day view attribution windows. These windows had been crediting your campaigns for people who saw your ad (but never clicked) and for people who clicked up to 28 days before buying.
When those windows disappeared, brands saw a 15-30% drop in reported conversions overnight. Not because fewer people were buying. Because the attribution methodology changed without a warning email.
Shopify also changed its default pixel setting to "Optimized" mode around the same time. That throttles checkout data going to Meta. Some stores saw Meta purchase events drop 20-40% immediately. You had to dig into your pixel health dashboard to find it. Most brands didn't.
Assuming a sudden drop in Meta-reported conversions means your ads stopped working. The January 2026 drops were mostly attribution methodology changes. Brands cut budgets on campaigns that were still profitable.
The iOS opt-out problem nobody fixes
Apple's App Tracking Transparency launched in 2021. When iOS users open an app, they see a prompt asking whether to allow tracking. 85% of them say no. That number hasn't moved in three years.
In the US, UK, and Australia, iOS represents 50-60% of mobile users. That means roughly half your potential buyers are invisible to Meta's Pixel, as far as standard tracking is concerned.
The result: Meta's Pixel, which used to capture 85-90% of actual conversions, now captures only 40-60%. Meta fills the gap with modeled conversions. These are statistical estimates of what it thinks happened based on similar users. They look real in your dashboard. They aren't conversions you can verify.
Why three dashboards give you three different answers
Pull the same 30 days across Meta Ads Manager, Shopify, and Google Analytics 4. You'll get three different revenue numbers for the same campaigns.
Meta Ads Managerreports revenue attributed to your campaigns using real tracked clicks, view-through data, and modeled conversions for iOS users it can no longer track directly. It's the highest number. It includes people who may have bought anyway.
Shopifydefaults to last-click attribution. If a customer clicked a Google Shopping ad three days before buying, Shopify gives Google the credit. Meta gets nothing, even if the customer first discovered the brand through a Meta ad. It's usually the lowest number.
Google Analytics 4 sits in the middle. It uses data-driven attribution across all channels and splits credit between touchpoints. It gives Meta partial credit. But not the same credit Meta gives itself.
All three are measuring the same purchases. None of them are lying. They have completely different definitions of what counts as Meta's contribution. This is why evaluating your actual marketing ROI requires looking across all three sources, not trusting any single dashboard in isolation.
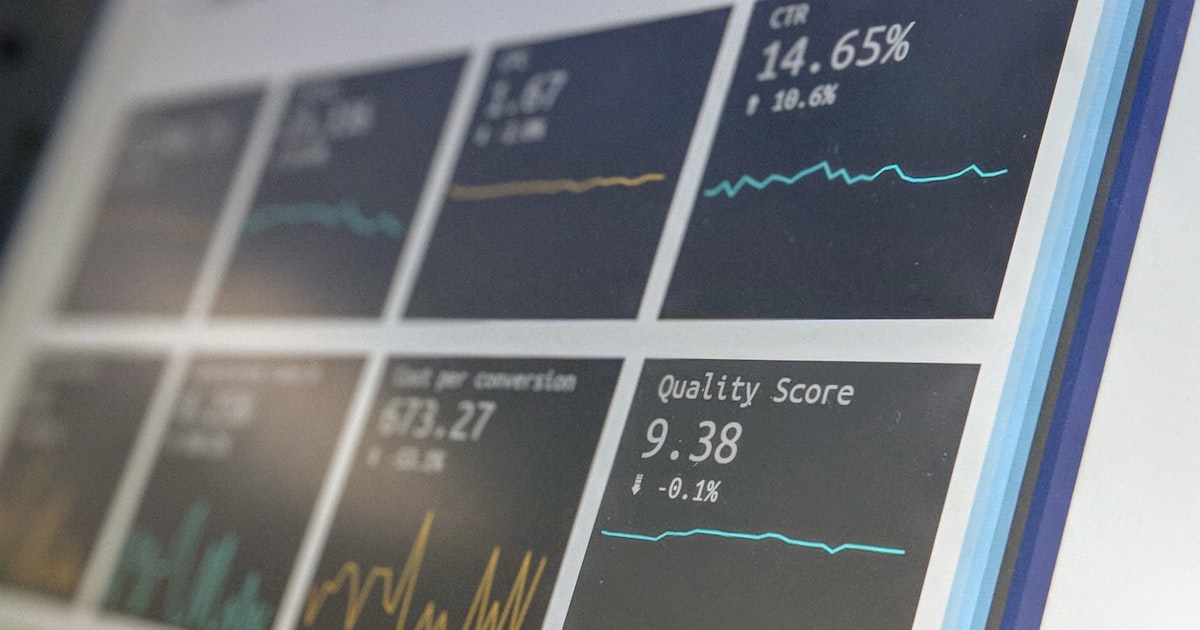
For most DTC ecommerce brands, Meta self-reported ROAS runs 2-3x higher than what first-party last-click attribution shows for the same period. Your real number sits somewhere between the two. The question is where.
What the attribution gap actually costs
The danger isn't a mismatch in spreadsheets. It's making spend decisions on the wrong number in either direction.
I've audited dozens of Shopify accounts where Meta reported 4x ROAS. When we pulled first-party data and ran the blended efficiency metric, the actual return was 1.8-2.1x on new customer acquisition. Real money was being recycled into campaigns that weren't performing at the rate the dashboard suggested.
On the flip side, some brands saw their January 2026 conversion numbers crash and pulled budget on campaigns that were still working. The conversions were real. The reporting methodology had changed. They cut a profitable channel because the dashboard scared them.
This hits hardest if you're already in the DTC ad spend trap where 25-35% of revenue is going to paid media. At that level, misreading attribution by 40% means misallocating a massive chunk of your marketing budget every single month.
How to actually measure your real Meta ROI
You're not going to fix iOS attribution. Apple isn't changing course. But you can get close to accurate with three moves.
Run Meta's Conversions API alongside your Pixel. CAPI sends conversion events server-side, bypassing the iOS Pixel block. Running both together typically recovers 60-75% of the iOS conversion signal you've been missing. Your Shopify admin has a native CAPI integration now. It takes about 20 minutes to set up and it's free.
Use Marketing Efficiency Ratio as your north star. MER is total revenue divided by total ad spend across all channels. It sidesteps the attribution war entirely. If you put $10,000 into ads and generate $35,000 in revenue that week, your MER is 3.5. That's a real number. No platform self-reporting required.
Cross-reference instead of picking sides. Pull 30 days in both Meta and Shopify and calculate the ratio. For brands spending above $5K/month on Meta, the gap should run 30-50%. If Meta is reporting 3x what Shopify shows, your modeled conversions are doing heavy lifting. Treat Meta ROAS as an upper bound. Treat Shopify last-click as a lower bound. Your real number is somewhere in the middle.
This also changes how you think about channel mix. When you see what Google Shopping actually returns on a first-party basis versus Meta's self-reported numbers, the comparison looks very different.
Server-side tracking via Conversions API typically recovers 60-75% of lost iOS conversion tracking on its own, per independent iOS attribution research. Combined with a blended MER metric, most brands can get close to accurate attribution without replacing their entire analytics stack.
Why AI changes the equation here
The attribution problem is a data problem. You have three imperfect sources, each telling a partial truth. Getting an accurate read means reading them together and weighting each signal correctly.
AI attribution layers read server-side data, Shopify last-click, and cross-channel sessions at the same time. Then they output one view: what each campaign actually drove, with iOS gaps accounted for. No more flipping between three dashboards and guessing.
When I run this for ecommerce accounts, the first output is usually a recalibrated picture of every active campaign. Some campaigns that looked marginal are actually profitable. Some that looked great have been getting over-credited by modeled conversions. The budget reallocation that follows is usually the highest-ROI change we make in month one.
For the full picture on what this looks like in practice, AI marketing for ecommerce covers how attribution layers fit into the broader stack. Getting your numbers right isn't a nice-to-have. It's the foundation every other marketing decision is built on.
Frequently asked questions
Why does Meta show different revenue than Shopify?
Meta and Shopify use different attribution models. Meta includes view-through conversions and modeled data for iOS users it can no longer directly track. Shopify defaults to last-click attribution. For most ecommerce brands, Meta reports 40-70% more revenue than Shopify attributes to paid social for the same time period.
How much does iOS affect Meta ad attribution for ecommerce brands?
Significantly. 85% of iOS users opt out of tracking under Apple's App Tracking Transparency framework. iOS represents 50-60% of mobile users in the US, UK, and Australia. As a result, Meta's Pixel now captures only 40-60% of actual conversions on iOS devices, down from 85-90% before ATT launched in 2021.
What happened to Meta attribution windows in January 2026?
On January 12, 2026, Meta deprecated its 7-day view and 28-day view attribution windows. Brands that relied on these windows saw a 15-30% overnight drop in reported conversions. Shopify also changed its default pixel to Optimized mode around the same time, causing an additional 20-40% drop in Meta purchase event reporting for some stores.
What is Marketing Efficiency Ratio and why is it better than ROAS?
Marketing Efficiency Ratio (MER) is total revenue divided by total ad spend across all channels. It avoids attribution model disagreements entirely by measuring your whole business output against your whole ad investment. A MER between 3:1 and 5:1 indicates healthy paid media efficiency without relying on any platform's self-reported data.
Can I trust Meta ROAS numbers for budget decisions in 2026?
Use them as a directional signal, not an absolute number. Meta's Advantage+ Attribution fills gaps for iOS users with modeled data, which inflates reported conversions. Cross-reference Meta's CAPI data with Shopify last-click and a blended MER metric. Treat Meta-reported ROAS as an upper bound. Your real number is lower.

Want to see where your marketing stands?
Get a free AI-powered audit of your online presence. Takes 30 seconds.
Get my free audit